Usage and Governance Architecture – Data Flows
This document provides an overview of how data flows from Microsoft Graph into Teamwork Analytics Usage and Governance for reporting, automation and alerting.
The solution can be deployed as SaaS managed by Modality in Azure, SaaS managed by Modality in customer Azure tenant or customer self-deployed in their Azure tenant (CAT).
1. Data Ingest – Microsoft Graph
Usage and Governance architecture is collecting information from the following Graph Endpoints:
- Teams- providing a summary of user usage and details of every message and reaction and every team and channel
- SharePoint – for file information stored in teams
- Microsoft Graph for User Attributes – to map users to Active Directory attributes such as department or role
The data is collected from Graph via granting read-only access to the relevant graph endpoints. Active Directory information is collected once a day and the latest attributes are held for all users. Team and SharePoint file data are collected on a constant loop, depending on the size of your environment this will typically update multiple times a data. In exceptionally large environments, with multiple hundreds of thousands of users, it can take more than 24 hours to collect this data.
Data is collected by the Teamwork Analytics Windows Service (collector) running on an Azure virtual machine.
2. Data Processing – Windows Service on Azure virtual machine
Once data is collected from the API’s it is processed and stored.
- Store Azure AD attributes for users
- Collect and store usage information
- Calculate per-user usage metrics for channel messages
- Store team and channel information
- Process any retention policies
- Process any Anonymisation policies
3. Stored Data – Azure SQL
Call, Meeting and user data is kept in the following Azure SQL stores:
- Store RAW graph response for any future troubleshooting
- Store optimised subset of data for every stream of every call/meeting – for deep-dive reporting
- Optimised aggregate tables or call and meeting data for longer-term storage and reporting
- Application Insights for logging and solution performance reporting
These are used for reporting, automation and alerting. Retention of each of these can be defined by the customer
4. Reporting – Power BI
Reporting is via Microsoft Power BI. Power BI reads data from Azure SQL on a regular schedule, up to 8 times a data for Power BI Pro and more for Power BI premium. Data is cached in the Power BI service, meaning reports are fast to render and filter.
Power BI reports are installed on customer tenants and given read-only access to the Azure SQL. Here are the full details of all reports available.
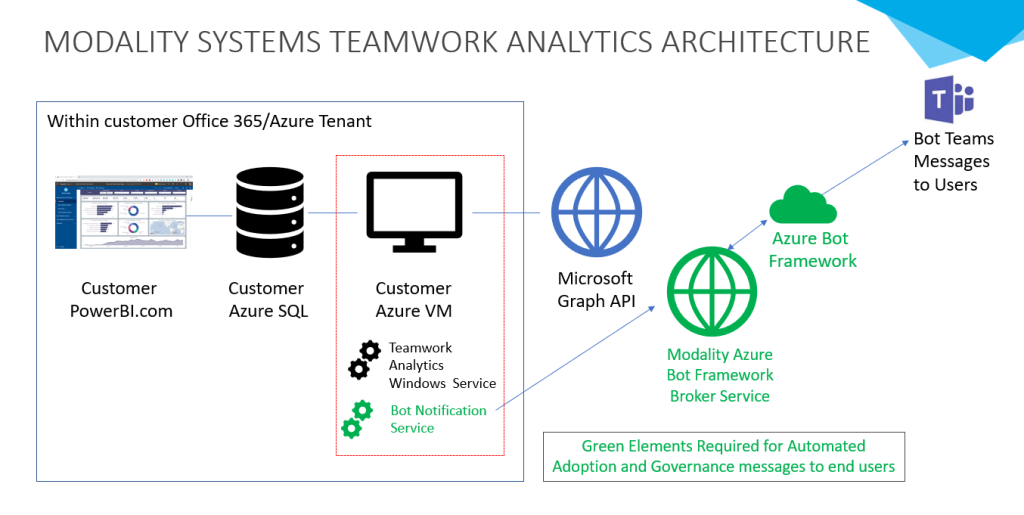
5. Automation – Teams adaptive cards to end-users – Azure Bot Framework
Automation refers to sending end users automated adaptive card messages directly in Microsoft Teams. These are triggered by regular queries of the stored data. A SQL query is created to trigger based on agreed attributes, such as usage and AD attributes, then messages are sent to the relevant target users.
Adaptive cards can be designed to meet specific customer requirements, including graphics, charts and icons.
Messages are sent via Azure Bot Framework.
6. Alerting – Email, Channel Messages or Tickets in ITSM platform – Azure Logic Apps
Alerting can be used to notify IT of issues that need resolution. Teamwork Analytics can configure alerts to your exact requirements leveraging the power of Azure Logic Apps. Example alerts:
- Team has been out of compliance for X period
- Guests are over Y days without any activity
- 2 external guest domains are in the same team
These require Azure logic apps that can be configured by customers or Modality.