-
Teamwork Analytics
-
-
- Target Specific Team Owners by Country with Information
- Reminder about Team Guests
- New Public Teams without Guests
- Single Owner Reminder with Channel ID
- Public Teams Reminder with Channel ID
- Target Specific Team Members by AD attributes
- Teams Activity Reminder with Channel ID
- New Public Teams without Guests
-
-
- Summary
- Activity by Country and Modality
- Active User Counts
- Active User Percentages
- Active User Percentages All Bands
- Month on Month
- Device Usage
- Device Usage Details
- Avg Use Per User Per Day by Country
- Relative User Activity
- Users and Attributes
- Custom AD Attributes
- Data Freshness Detail
- Daily Active Users
- Weekly Active Users
- Monthly Active Users Percentage
- Relative Daily Active Users
- Relative Weekly Active Users
- Relative Monthly Active Users
- Activity Counts Daily
- Activity Counts Weekly
- Activity Counts Monthly
- Per User Activity Daily
- Per User Activity Weekly
- Per User Activity Monthly
- Show Remaining Articles (10) Collapse Articles
-
- Team Stats
- Teams Distribution
- User Collab Activity
- Collab Activity (Averages)
- Collab Activity (Totals)
- User Mention Activity
- Team Files
- Per Team Profile
- Guest Distribution
- Guest Details
- Users and Attributes
- Threads Country Interaction
- Replying Country Interaction
- Threads Department Interaction
- Replying Department Interaction
- Active Teams Files and Chat
- Teams Channel Chat Activity
- Data Freshness Detail
- Show Remaining Articles (3) Collapse Articles
-
- Meeting Trends
- Meeting Detail
- Meetings Per User Trends
- Meeting Join Stats
- Meeting Join Dashboard
- Meeting Joins by Country
- Meeting Join Country Detail
- Meeting Joins by User
- Calls Per User Trends
- Call Stats
- Calls Dashboard
- Calls by Country
- Calls Country Detail
- Calls by Users (All)
- Calls by Users (Last 14 days)
- Interaction Overview (Last 14 days)
- Call Interactions (Last 14 days)
- Meeting Interactions (Last 14 days)
- Show Remaining Articles (3) Collapse Articles
-
-
-
- Querying the RAW JSON Call Records Files
- Data Issues with Microsoft Teams user activity Get user detail Endpoint
- Check Data Freshness from Microsoft Reporting API
- Get Call Record from Graph
- Calls and Meetings Database Schema
- Deploy a Calls & Meetings Automation scenario (CAT)
- CAT Installs – Customer Monitoring
- Configure Task Scheduler for Automation
- SQL Backups
- CAT Configuration Notes
- Data Nuances
- DeadLetterManager
- Calls and Meetings Aggregate Table Calculations
- Anonymisation of Selected Users PII Data
- Excluding teams from file scan
- Configure Custom User Attributes – Usage and Governance
- Configure Data Retention – Usage and Governance CAT
- Data Collection Configuration (Scan)
- Show Remaining Articles (3) Collapse Articles
-
- Call Queue and Auto Attendant data
- Collecting Logs – Usage and Governance
- Comparing Teamwork Analytics to other solutions
- Data Collection Explained Usage and Governance
- Data Dictionary and Reporting Capabilities Usage and Governance
- Decommission
- Determining current data collection state
- FAQ Usage and Governance
- Files / Drive Items
- Messages
- Monitoring and Maintenance Tasks Usage and Governance CAT
- Relative User Activity Thresholds
- Security Details
- Usage and Governance Data Collected and Capabilities
- Usage and Governance Dependencies
- Calls & Meetings Definitions
- Database Version
- Show Remaining Articles (2) Collapse Articles
-
-
Teams Audit
-
Teams Chat Assist
-
OneConsultation
Determining current data collection state
Logging report
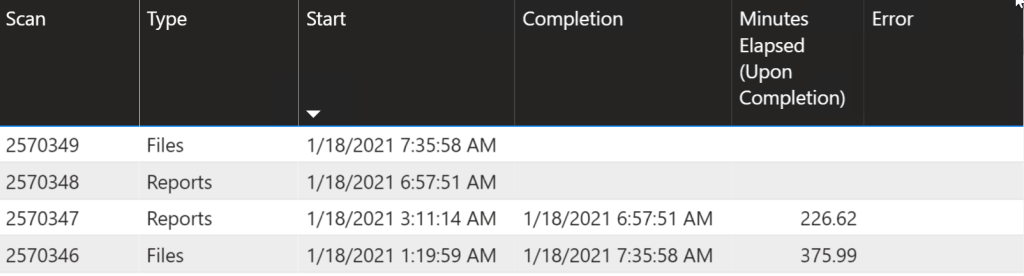
In the troublehsooting report, identify the scan you are interested in from the Scan History Page
This will list all the scans, both in progress and completed.
Once a scan id has been identified for further investigation, head over to the Health Page and select the scan from the drop down, ensuring no other filters are selected.
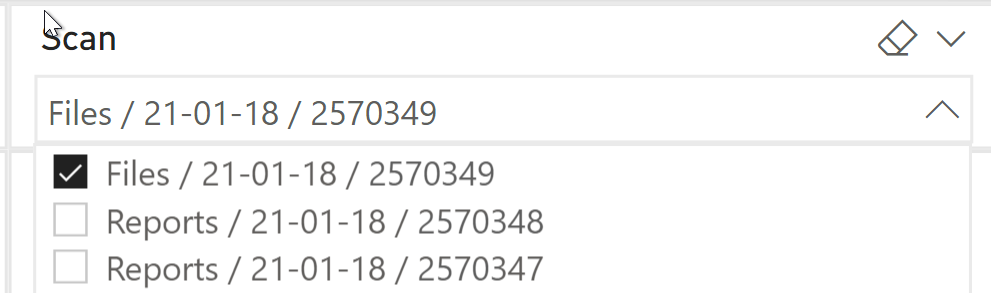
This will display a list of tasks and how many have completed.

There are two main row types of interest.
- Graph API GET [Entity Type] @ Task L2
- SQL AddOrUpdate [Entity Type] @ Task L3
using the completed count for these two rows for a particular entity you can calculate
- How many records have been returned from graph
- How many records have been saved to the database (You can also calculate this in SQL; select from the table for the entity where LastModifiedTime > ScanStartTime)
We also need to find out how many entities we’re expecting to receive. for this we can do any of the following
- Look how many records for the entity there were on the last complete scan.
- Look in the database and on the table for the entity do a SELECT COUNT(*) WHERE Deleted = 0
- Use a microsoft portal/report
Once we have graph returned/saved/expected counts we can use them to compare and predict.
For example.
- Graph API Get Team = 100
- SQL AddOrUpdate Team = 50
- Expected Team Count = 150.
- % from graph = 100/150 = 66%
- % saved to db = 50/150 = 33%
you can then use the duration of the scan so far to determine time of completion.
Example continued.
- Current scan duration 1hr
- % saved to db (from above) = 33%
- Estimated scan time = 1hr / 0.33 (33%) = 3hrs
- Estimated time remaining = 3hrs – 1hr = 2hrs