-
Teamwork Analytics
-
-
- Target Specific Team Owners by Country with Information
- Reminder about Team Guests
- New Public Teams without Guests
- Single Owner Reminder with Channel ID
- Public Teams Reminder with Channel ID
- Target Specific Team Members by AD attributes
- Teams Activity Reminder with Channel ID
- New Public Teams without Guests
-
-
- Summary
- Activity by Country and Modality
- Active User Counts
- Active User Percentages
- Active User Percentages All Bands
- Month on Month
- Device Usage
- Device Usage Details
- Avg Use Per User Per Day by Country
- Relative User Activity
- Users and Attributes
- Custom AD Attributes
- Data Freshness Detail
- Daily Active Users
- Weekly Active Users
- Monthly Active Users Percentage
- Relative Daily Active Users
- Relative Weekly Active Users
- Relative Monthly Active Users
- Activity Counts Daily
- Activity Counts Weekly
- Activity Counts Monthly
- Per User Activity Daily
- Per User Activity Weekly
- Per User Activity Monthly
- Show Remaining Articles (10) Collapse Articles
-
- Team Stats
- Teams Distribution
- User Collab Activity
- Collab Activity (Averages)
- Collab Activity (Totals)
- User Mention Activity
- Team Files
- Per Team Profile
- Guest Distribution
- Guest Details
- Users and Attributes
- Threads Country Interaction
- Replying Country Interaction
- Threads Department Interaction
- Replying Department Interaction
- Active Teams Files and Chat
- Teams Channel Chat Activity
- Data Freshness Detail
- Show Remaining Articles (3) Collapse Articles
-
- Meeting Trends
- Meeting Detail
- Meetings Per User Trends
- Meeting Join Stats
- Meeting Join Dashboard
- Meeting Joins by Country
- Meeting Join Country Detail
- Meeting Joins by User
- Calls Per User Trends
- Call Stats
- Calls Dashboard
- Calls by Country
- Calls Country Detail
- Calls by Users (All)
- Calls by Users (Last 14 days)
- Interaction Overview (Last 14 days)
- Call Interactions (Last 14 days)
- Meeting Interactions (Last 14 days)
- Show Remaining Articles (3) Collapse Articles
-
-
-
- Querying the RAW JSON Call Records Files
- Data Issues with Microsoft Teams user activity Get user detail Endpoint
- Check Data Freshness from Microsoft Reporting API
- Get Call Record from Graph
- Calls and Meetings Database Schema
- Deploy a Calls & Meetings Automation scenario (CAT)
- CAT Installs – Customer Monitoring
- Configure Task Scheduler for Automation
- SQL Backups
- CAT Configuration Notes
- Data Nuances
- DeadLetterManager
- Calls and Meetings Aggregate Table Calculations
- Anonymisation of Selected Users PII Data
- Excluding teams from file scan
- Configure Custom User Attributes – Usage and Governance
- Configure Data Retention – Usage and Governance CAT
- Data Collection Configuration (Scan)
- Show Remaining Articles (3) Collapse Articles
-
- Call Queue and Auto Attendant data
- Collecting Logs – Usage and Governance
- Comparing Teamwork Analytics to other solutions
- Data Collection Explained Usage and Governance
- Data Dictionary and Reporting Capabilities Usage and Governance
- Decommission
- Determining current data collection state
- FAQ Usage and Governance
- Files / Drive Items
- Messages
- Monitoring and Maintenance Tasks Usage and Governance CAT
- Relative User Activity Thresholds
- Security Details
- Usage and Governance Data Collected and Capabilities
- Usage and Governance Dependencies
- Calls & Meetings Definitions
- Database Version
- Show Remaining Articles (2) Collapse Articles
-
-
Teams Audit
-
Teams Chat Assist
-
OneConsultation
KPI Trees

Summary
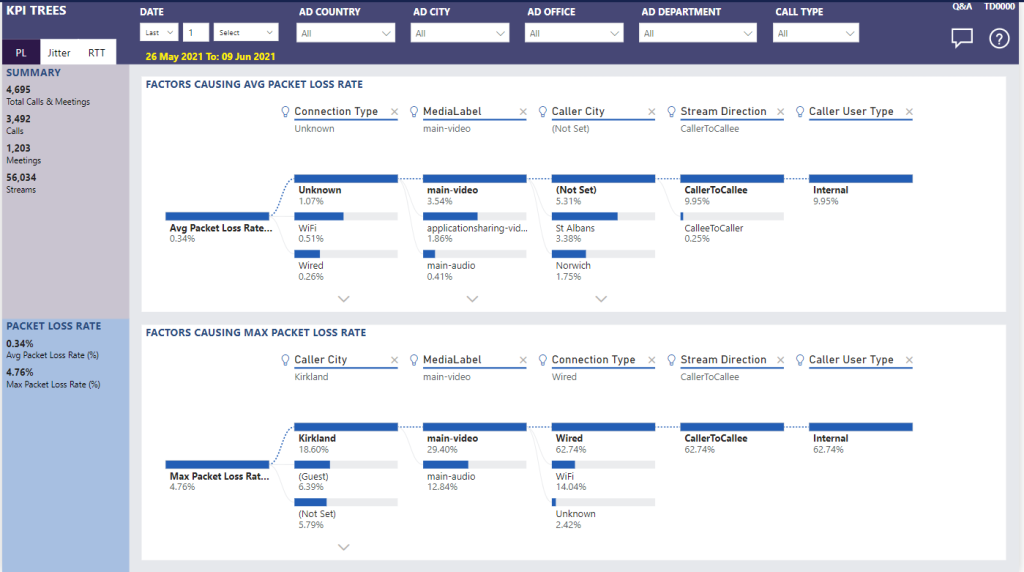
This report gives the factors for each of the network KPIs across different areas, with the tree expanding and breaking down to drive you to all the factors and their contribution, relative to the KPI.
The trees can be interacted with for drill down, valuable for root cause analysis by exploring different correlations of the KPI to connection types, location, media types, stream direction and caller types.
Learn more about network KPIs and the effect they have on calls.
Use the date, Active Directory and Call Type slicers at the top of the report to limit to a particular area of interest. Further advanced filtering can be carried out using the Filter pane on the right hand side.
This report tells me
Summary count of calls, meetings and streams
KPI Summary
- Average and maximum packet loss, jitter and round trip
Factors affecting KPIs
- Average and maximum packet loss, jitter and round trip by:
- connection type (wifi, wired, mobile, tunnel)
- media label (video, audio, app sharing)
- location (city)
- stream direction (caller to callee, callee to caller)
- user type (internal / external)
Tips
Use the KPI tabs in the top left corner to switch the view between Packet Loss, Jitter and Round Trip Time.
Note: The filter value selected is an association to the % which is highest , ranked. Meaning when the “type” is selected, this means that is an assocation to the overall factor.
Example if 0.34% average packet loss then the “connection type” will account for a % where say Mobile is highest. If in this example mobile is show as 4% and no other “connection” assocation is made then 96% is simply not a connection factor identified to the 0.34% packet loss.
So Mobile as connection type has 4% avg packet loss which contributes to the all-up 0.34% packet loss.
If there isn’t a node on the tree for a specific connection type then it’s not a contributing factor to the all-up Packet loss.
